Common standards*
(Most items apply to sustained work)
| Maximum two-handed lift (with vertical travel distance) | 20 lbs | |
| Maximum two-handed carry (no vertical travel distance) | 30 lbs | |
| Maximum small lot container weight (incl. material & container) | 30 lbs | |
| Maximum extended full arm horizontal lateral force | 15 lbs | |
| Maximum pinch force | 9 lbs | |
| Maximum push button force | 3 lbs | |
| Palm Buttons — eliminate where feasible, otherwise: | 1.9 lbs | |
| Maximum hand crank control force | 5 lbs | |
| Maximum manual lever force | 29 lbs | |
| Maximum two-handed vertical downward pull | 24 lbs | |
| Maximum two-handed push/pull force: | Initial | 44 lbs |
| Sustained | 24 lbs |
* Auto industry guidelines
Push, pull, carry guidelines
The above guidelines provide several limits that apply to push, pull, and carry. The following table provides limits that incorporate additional variables:
- The Distance that the load will be moved
- The Frequency the task is performed
- The Initial Force to start the load in motion
- The Sustained Force needed to keep the object in motion
Maximum Acceptable Force (lbs)
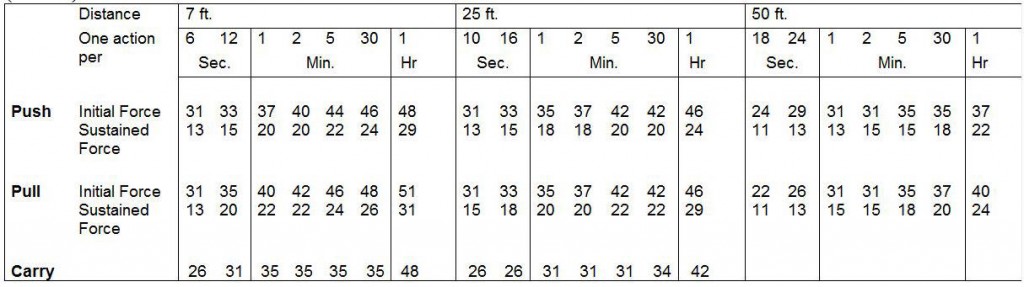
These limits are based on two assumptions: (1) the criterion is ninety percent of the female population able to perform at this level without excessive strain, and (2) the data assume the load is handled at about waist height. For additional parameters such as different heights and segments of the population, refer to the complete table* (commonly referred to as the “Snook tables”).
*Snook S. and Ciriello, V., 1990. The design of manual handling tasks: Revised tables of maximum acceptable weights and forces. Ergonomics 34(9):1197-1213.
[add Mital reference to exertion when kneeling and lying down]
Push/pull measurements
 |
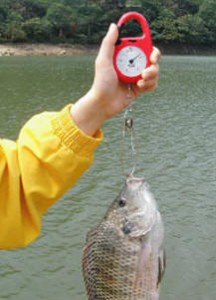 |
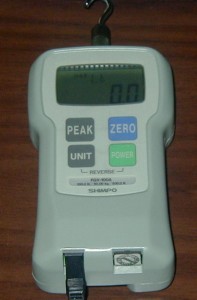
| Force gauge | Fish scale |
Many loads referenced above are easily measured with common scales. For push and pull forces, an easy-to-use force gauge is needed. These gauges come with a variety of end pieces, including hooks that can be used for pulling. Furthermore, with some ingenuity, the end pieces can be adapted (or customized by a workplace machine shop) and used for many applications.
It is possible to use an inexpensive fish scale (available in sporting goods stores or departments) if the loads are <50 lbs. and the need for a force gauge is infrequent. Fish scale only pull, and do not push, but with some creativity, many forces can be measured. Other similar types of spring scales may also be available that can be used for heavier loads.
Grip strength
 |
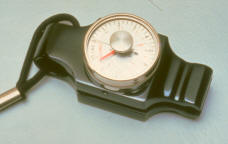 |
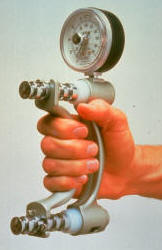
| Hand dynamometer (grip strength tester) | Pinch gauge |
There are no common standards for hand grip exertion because of the difficulty in obtaining measurements. Usually, such measurements are only done in laboratory situations and not in the workplace.
However, rough estimates of grip forces can be made by using a hand dynamometer, which are often available in medical clinics, particularly those that specialize in hand disorders. Steps are the following:
- Have one or two employees squeeze the device with the same amount of exertion they normally use to do the task. The goal is to mimic on the hand dynamometer the effort used, for example, to squeeze a pliers.
- Record the result, have them do the task again to remind them of how much effort the task requires, then try the gauge once again.
- Repeat several times and average the results. Usually, after a few attempts and among several employees, a rough estimate emerges. The number of samples required depends upon the use of the data and the variance observed.
This technique is dependent on the employee’s ability to mimic the effort and is only approximate. Nonetheless, useful data can be obtained in this fashion. Pinch forces can be estimated in the same way, using a pinch gauge.
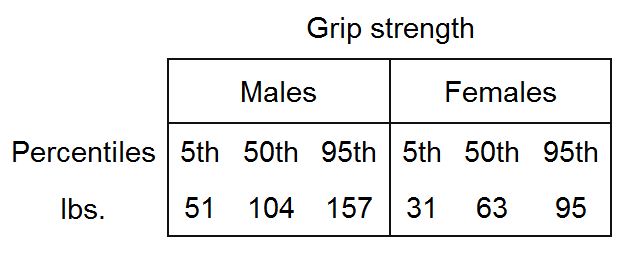
Grip strength anthropometry provides some reference points for comparison.
See note on gender-based strength differences.
Exertion vs. force: Definitions
The terms “force” and “exertion” are often used interchangeably in everyday use, but from a technical ergonomics perspective are different. Exertion is the tension produced by muscles and transmitted through tendons to produce force. Force is the externally observable result of a specific movement or exertion.
Exertion is the key factor of concern; however, it is difficult to observe and measure. Thus, it is more common to concentrate on force and assume a correlation with exertion. In this sense, force is a proxy for exertion, recognizing that effects on individuals may differ.
Gender-based strength differences
Anthropometric data usually provide measurements for both males and females, for several reasons, including:
- The primary value is to accommodate more people. That is, by basing criteria on the 5th percentile female, more individuals are included than if based on the 5th percentile of a mixed male/female population. Thus the impact is inclusive, rather than discriminatory.
- Separate data provide capability for increased customization of criteria.
However, providing gender-based data can inadvertently reinforce some common misperceptions, especially for strength differences. But the data contradict some commonly held misperceptions.
 |
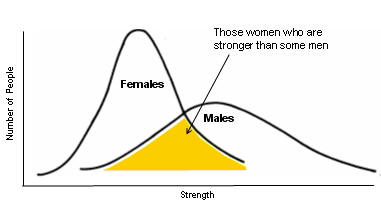 |
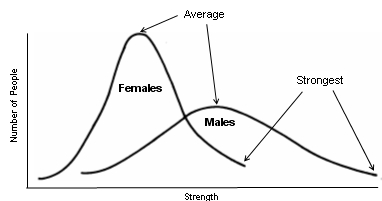
| Obvious gender differences | Less obvious overlap |
Whenever strength data are graphed by gender, the results are overlapping normal curves. As shown above, some conclusions are obvious: The average male is stronger than the average female and the strongest male is stronger than the strongest female.
However, less obvious is the overlap, i.e. the number of women who are stronger than some men. Typically, about 5% of the female population is stronger than about 50% of the male population (note the numbers in the linked page on grip strength). Similarly, about 50% of the female population is stronger than about 10% of the male population.
We tend to think (at least until recently) that all men are stronger than all women, i.e. that the two curves do not overlap. But the overlap disproves that notion. The conclusion is that sweeping generalizations based on gender may not be valid. It is the individual who matters.